|
Current location: Home > Physical Processes Model > Reach 2 > Primary DriverPhotosynthesis |
|
Reach 2: Primary Driver—Photosynthesis
Photosynthesis in Reach 2 is affected by the four secondary drivers shown above. Click on a secondary driver to jump down to the discussion of that driver. See the Basic Concepts page for a general discussion of how the secondary drivers affect the primary driver. Factors affecting sunlight are, for the most part, not reach specific and are therefore described only in the general discussion on the Basic Concepts page. Measurements at Mossdale (mid-point of Reach 2) indicate that the DO concentration is supersaturated during the afternoon of many summer days. This level of saturation indicates that algae photosynthesis is a major factor affecting DO concentrations in Reach 2 because photosynthesis is the only process that can raise DO above saturation. The proportion of DO concentrations in Reach 2 that are derived from photosynthesis has not been identified. Secondary Driver—Algal Biomass Concentration Potential sources of imported algal biomass are described in Reach 2: Secondary Driver—Carbonaceous Biochemical Oxygen Demand Concentrations. Photosynthesis is directly related to the live algal biomass, and photosynthesis can increase the biomass concentration and load at the downstream end of Reach 2. As live algal biomass increases in Reach 2, the amount of oxygen produced through photosynthesis increases. Supersaturation of DO in the afternoons is often observed in Reach 2, indicating that some of the excess DO will be lost to the atmosphere through deaeration. Jump to "Photosynthesis > Secondary Driver—Algal Biomass Concentration" under:
Reach 1 |
Reach 3 Light is the limiting factor to algal growth throughout the San Joaquin River (Lehman et al. 2001). By limiting light, turbidity may limit algal photosynthesis, which may limit algal DO production in Reach 2. The figure below shows the daily TSS measurements from Vernalis for 1999. TSS was 60120 mg/L during the summer period. Turbidity was less than half these values at about 2040 NTU.
Turbidity data measured at Mossdale in JuneOctober 2000 and 2001 ranged from 12 to 31 NTUs, with highest turbidity levels generally occurring in July and August and lowest turbidity levels generally occurring in September and October. Mean turbidity in 2000 and 2001 was about 20 NTU (Jones & Stokes 2002a; Jones & Stokes 2001a.) Turbidity data were also measured at the downstream end of Reach 2 at Channel Point in 2000 and 2001. The mean turbidity was roughly 25 NTUs in both years. (Lehman et al. 2001; Lehman 2003.) Jump to "Photosynthesis > Secondary Driver—Turbidity" under:
Reach 1 |
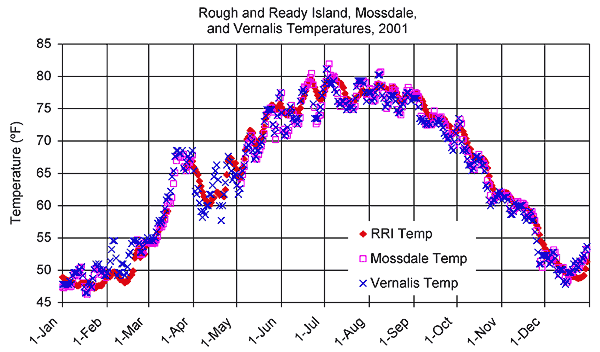
Reach 3 Secondary Driver—Water Temperature Water temperatures in Reach 2 (at Mossdale) ranged from less than 50ºF (10ºC) to greater than 68ºF (20ºC) in 2001 (Jones & Stokes 2002b). In portions of June, July, and August, water temperatures in the San Joaquin River were greater than 77ºF (25ºC) (Jones & Stokes 2002b). The coldest temperatures (less than 10ºC) were recorded only in January, early February, and December (Jones & Stokes 2002b). As shown in the figure below, water temperatures in Reach 2 (Mossdale) are very similar to temperatures in Reaches 1 (Vernalis) and 3 (Rough and Ready Island).
Jump to "Photosynthesis > Secondary Driver—Water Temperature" under:
Reach 1 |
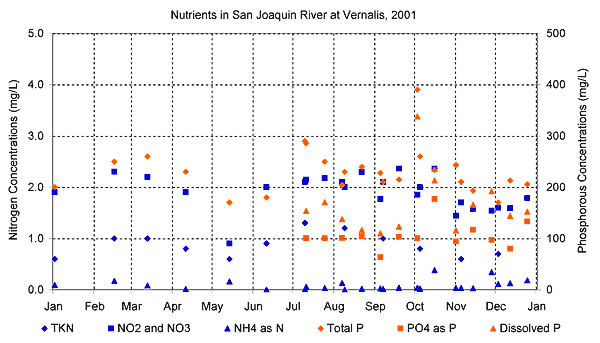
Reach 3 Nutrients in Reach 2 are either discharged directly to Reach 2 (i.e., Stockton RWCF) or imported from Reach 1. Water quality in the San Joaquin River is affected by inputs from agriculture, municipalities, dairy and feedlot industries, golf course and lawn maintenance practices and natural riparian processes (Lee and Jones-Lee 2000). These inputs include large amounts of nitrogen- and phosphorus-based compounds, which support algal growth (Lee and Jones-Lee 2000). Research indicates that nitrate concentrations at Vernalis are generally 13 mg/L, and phosphate concentrations are generally between 0.1 and 0.5 mg/L (Lee and Jones-Lee 2000). Because these nutrient concentrations are much higher than concentrations that may limit algal growth, nutrients are generally assumed not to limit algal biomass or photosynthesis in the San Joaquin River. The primary factor affecting nutrients in Reach 2 are inputs from Reach 1 and the Stockton RWCF discharge. There are no significant tributaries joining the San Joaquin River in Reach 2, and agricultural diversions and returns are relatively minor. Diversions at Old River reduce flows in Reach 2 and thereby reduce the load of nutrients that reach the DWSC. Jump to "Photosynthesis > Secondary Driver—Nutrients" under:
Reach 2 |
Reach 3 Uncertainties in Photosynthesis Uncertainties related to understanding how DO produced through photosynthesis in Reach 2 may affect DO concentrations in the DWSC include:
Jump to "Photosynthesis > Uncertainties in Photosynthesis" under:
Reach 1 |
Reach 3 |