|
Current location: Home > Physical Processes Model > Reach 1 > Primary DriverPhotosynthesis |
|
Reach 1: Primary Driver—Photosynthesis
Photosynthesis is affected by the four secondary drivers shown above. Click on a secondary driver to jump down to the discussion of that driver. See the Basic Concepts page for a general discussion of how the secondary drivers affect the primary driver. Factors affecting sunlight are, for the most part, not reach specific and are therefore described only in the general discussion on the Basic Concepts page. The proportion of DO concentrations that is derived from photosynthesis has not been identified but is expected to increase with higher algae biomass concentrations. Measurements at Mossdale (the midpoint of Reach 2) indicate that the DO concentration is supersaturated during the afternoon of many summer days. This level of saturation indicates that algae photosynthesis is a major factor affecting DO in Reach 1 because photosynthesis is the only process that can raise DO above saturation. Secondary DriverAlgal Biomass Concentration Potential sources of algal biomass in Reach 1 are described in Reach 1: Secondary DriverCarbonaceous Biochemical Oxygen Demand Concentrations. Photosynthesis is directly related to the live algae biomass, and photosynthesis can increase the biomass concentration at the downstream end of Reach 1. As live algal biomass increases in Reach 1, the amount of oxygen produced through photosynthesis increases. Supersaturation of DO in the afternoons is often observed in Reaches 1 and 2, indicating that some of the excess DO may be lost to the atmosphere through deaeration. Jump to "Photosynthesis > Secondary Driver—Algal Biomass Concentration" under:
Reach 2 |
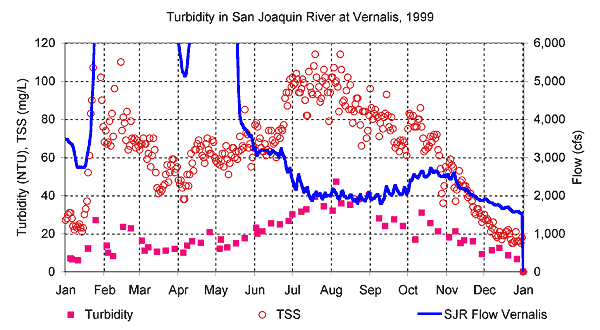
Reach 3 In addition to the sources of sediment described in the Basic Concepts discussion, suspended sediment levels in the San Joaquin River are also increased by the seven largest westside drains: Orestimba Creek, Spanish Grant Combined Drain, Olive Avenue Drain, Del Puerto Creek, Greyson Road Drain, Ingram Creek, and Hospital Creek (Kratzer and Shelton 1998). However, when the westside tributaries have increased flows with increased suspended sediment, the relatively clear eastside tributaries dilute the San Joaquin River turbidity with increased flow. The eastside tributaries contribute more streamflow to the San Joaquin River than the westside tributaries, so the flow increase may ultimately decrease the suspended sediment concentration in Reach 1 (Kratzer and Shelton 1998). Median suspended sediment from the agricultural discharges in the seven drains described above range from 134 to 790 mg/L. San Joaquin River concentrations range from 78 to 100 mg/L in Reach 1 (Kratzer and Shelton 1998). The figure below shows the daily TSS measurements from Vernalis for 1999. TSS was 60 mg/L to 120 mg/L during the summer. Turbidity was less than half these values at about 2040 NTU.
The relationships between suspended sediment concentrations, or turbidity, and light, and between light and photosynthesis in Reach 1 are known only in general terms. Research to identify these mechanisms are underway as part of the Upstream Studies (CBDA Grant) during 20052007. Jump to "Photosynthesis > Secondary Driver—Turbidity" under:
Reach 2 |
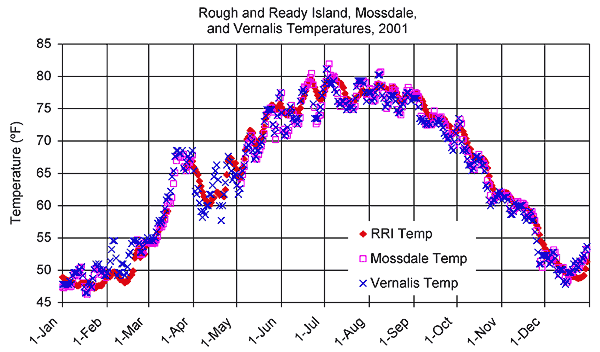
Reach 3 Secondary DriverWater Temperature Water temperature is assumed to be an important factor affecting photosynthesis rates in Reach 1. However, because sunlight and temperature both increase in the summer when highest algae biomass is observed, determining the relative importance of these two factors on algae growth and photosynthesis is difficult. Water temperatures in Reach 1 (at Vernalis) ranged from less than 50°F (10°C) to greater than 77°F (25°C) in 2001 (Brown 2002). In portions of June, July, and August, water temperatures in the San Joaquin River were greater than 77°F (25°C) (Brown 2002). The coldest temperatures (less than 50°F [10°C]) were recorded only in January, early February, and December (Brown 2002). As shown in the figure below, water temperatures in Reach 1 (at Vernalis) were very similar to temperatures in Reaches 2 (Mossdale) and 3 (Rough and Ready Island).
Ambient air temperature, temperature of water entering Reach 1, and residence time are the primary factors affecting water temperature. Jump to "Photosynthesis > Secondary Driver—Water Temperature" under:
Reach 2 |
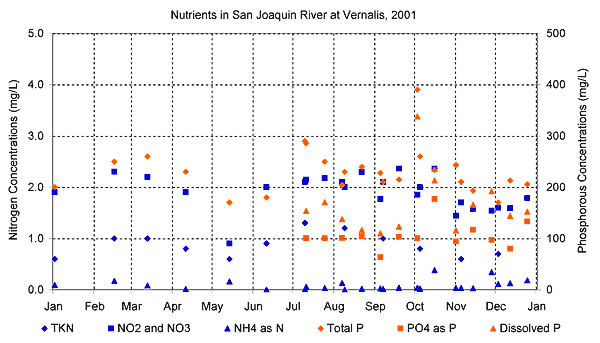
Reach 3 Nutrients are a necessary component of the photosynthesis process. Nutrient concentrations (i.e., nitrogen and phosphorus) in the San Joaquin River are affected by inputs from agriculture, municipalities, dairy and feedlot industries, golf course and lawn maintenance practices, and natural riparian processes (Lee and Jones-Lee 2000). These inputs include large amounts of nitrogen- and phosphorus-based compounds, which support algal growth (Lee and Jones-Lee 2000). The forms of nitrogen available for algae are nitrate and ammonia. The form of phosphorus available for algae is soluble orthophosphate (Lee and Jones-Lee 2000). Most of the particulate phosphorus cannot be used by algae (Lee and Jones-Lee 2000). Research performed in 2000 and 2001 found nitrate concentrations in the San Joaquin River above Vernalis ranged from less than 1 mg/L to 8 mg/L, with a median of 2.6 mg/L. Ammonia concentrations were relatively low compared to nitrate. Data were also collected on a series of tributaries to the San Joaquin River. Nitrate concentrations at the tributaries ranged from less than 1 mg/ to almost 20 mg/L, with a median of 2.7 mg/L. (Kratzer et al. 2004). The figure below shows bi-weekly nitrogen and phosphorus measurements, collected by UCD (Dahlgren) from Vernalis for 2001 (San Joaquin River Water Quality Data Atlas 2005).
The 2000 and 2001 research effort also evaluated phosphorus concentrations along the San Joaquin River. Measured orthophosphate concentrations ranged from 0.01 to 0.34 mg/L, with a median of 0.12 mg/L. Tributary concentrations of orthophosphate ranged from negligible to 2.27 mg/L, with a median of 0.08 mg/L. No overall temporal trends were observed during the study period, with relatively constant concentrations through the year. Phosphorus concentrations were greatest on the San Joaquin River near Patterson. Concentrations at Maze Road and at Vernalis were reduced by flow inputs from the Tuolumne and Stanislaus Rivers (Kratzer et al. 2004). Nitrate concentrations at Vernalis generally range from 1.4 to 2.5 mg/L (Kratzer et al. 2004), and phosphate concentrations are generally between 0.1 and 0.5 mg/L (Lee and Jones-Lee 2000). Because these nutrient concentrations are much higher than concentrations that may limit algal growth, nutrients are generally assumed not to limit algae biomass or photosynthesis in the San Joaquin River. Significant sources of nutrients to Reach 1 include the Tuolumne River, Harding Drain, and Mud Slough (Kratzer et al. 2004), as well as drainage from agricultural and managed wetlands (Hunt 2002). There is not, however, consensus on the type of drainage (agricultural or managed wetland) that provides the greatest quantities of nutrient inputs to the San Joaquin River (Stringfellow and Quinn 2002, Lee and Jones-Lee 2003). Jump to "Photosynthesis > Secondary Driver—Nutrients" under:
Reach 2 |
Reach 3 Uncertainties in Photosynthesis Uncertainties related to understanding how DO produced through photosynthesis in Reach 1 may affect DO concentrations in the DWSC include:
Jump to "Photosynthesis > Uncertainties in Photosynthesis" under:
Reach 2 |
Reach 3 |