|
Current location: Home > Physical Processes Model > Reach 1 > Primary DriverBOD Concentrations |
|
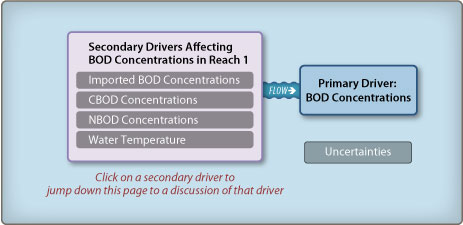
Reach 1: Primary Driver—BOD Concentrations
BOD concentrations in Reach 1 are affected by the four secondary drivers shown above. Click on a secondary driver to jump down to the discussion of that driver. See the Basic Concepts page for a general discussion of how the secondary drivers affect the primary driver. Based on data collected in JuneOctober 2001, Reach 1 BOD10 values ranged from approximately 2 to 39 mg/L (Foe et al. 2002). The highest BOD10 values in Reach 1 were observed at Lander, which has extremely low flows (approximately 2060 cfs) compared to downstream Reach 1 locations. Thus, these higher BOD10 values are likely a result of increased algae concentrations in relatively stagnant waters. In general, BOD10 in Reach 1 peaked in early September at all locations. Maze and Vernalis BOD10 measurements were very similar (range of 210 mg/L throughout monitoring period). BOD10 values at Patterson were typically 12 mg/L greater than Maze and Vernalis values. Secondary DriverImported Biochemical Oxygen Demand Concentrations BOD imported to Reach 1 (i.e., imported CBOD and NBOD) from tributaries and agricultural drainage is an important contributor to BOD concentrations. Algal biomass is assumed to be the major source of imported BOD. The largest inputs of algae biomass to Reach 1 are Mud and Salt Sloughs, which together with the San Joaquin River above Highway 165 may account for 90% of the total chlorophyll a load immediately at Vernalis (Foe et al. 2002, Lee and Jones-Lee 2003), based on a simple model of exponential growth. This large input is primarily a result of high chlorophyll a concentrations (average concentrations greater than 20.5 µg/L) (Stringfellow and Quinn 2002), rather than high flows, because the three sources contribute only about 16% of the total flow at Vernalis (Quinn and Tulloch 2002, Foe et al. 2002). In addition, these three sources are significant inputs of algal biomass because of long travel times to Vernalis, which allow for longer periods of algal growth in the San Joaquin River (Foe et al. 2002). Water drained from managed wetlands is not believed to be a substantial source of algal biomass to Mud Slough and, ultimately, the San Joaquin River during the summer but may contribute greater algal biomass or other CBOD in September (Stringfellow and Quinn 2002). The eastside tributaries (i.e., the Merced, Tuolumne, and Stanislaus Rivers) do not contribute high concentrations of algal biomass or other BOD to Reach 1. Nonalgal sources of CBOD in Reach 1 include agricultural irrigation drainage, agricultural stormwater runoff, riparian vegetation, urban dry season runoff, urban wastewater drainage, and dairy and animal husbandry areas (Roberson and Wolf 2004, Lee and Jones-Lee 2000). The Turlock Wastewater Treatment Plant and upstream dairies may be contributing organic matter to the Harding Drain (Lee and Jones-Lee 2003). Los Banos Creek, Salt Slough, San Luis Drain, and Harding Drain generally discharged the highest ammonia concentrations to the San Joaquin River during 2000 and 2001 (Kratzer et al. 2004). Harding Drain, which receives City of Turlock Wastewater Treatment Plant effluent (Kratzer et al. 2004), had high ammonia concentrations of 0.32.5 mg/L. The Tuolumne, Stanislaus, and Merced Rivers typically contributed low ammonia concentrations (Kratzer et al. 2004). Jump to "BOD Concentration > Secondary Driver—Imported BOD Concentrations" under:
Reach 2 |
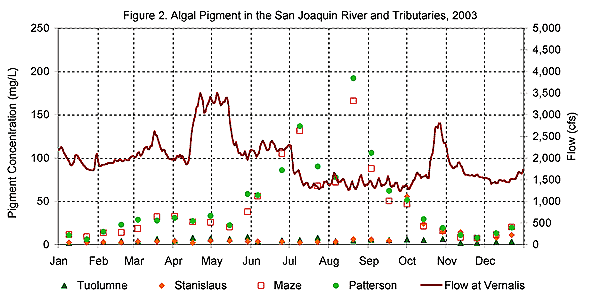
Reach 3 Secondary DriverCarbonaceous Biochemical Oxygen Demand Concentrations CBOD is the result of decay of any organic material. Algal biomass is assumed to be the most important contributor to BOD concentrations in Reach 1. One study found that, based on multiple regressions, chlorophyll a (algal biomass) is the most important factor affecting BOD in Reach 1 and accounts for 7076% of the variation in BOD10 measurements (Foe et al. 2002). Additional support that algal biomass is the most important contributor to BOD concentrations in Reach 1 is shown in Figure 1 (below) . Although BOD has not been measured in the eastside tributaries to the San Joaquin River, VSS has been measured and is approximately equivalent to BOD5. The Reach 1 VSS concentrations at Maze and Patterson Figure 1 (below) follow the seasonal patterns of algal concentrations at those locations Figure 2 (below). Both the algal biomass and VSS concentrations increase during JuneSeptember, indicating that the Reach 1 VSS concentrations and, therefore, BOD concentrations are strongly affected by algal concentrations.
In general, chlorophyll a concentrations increase in Reach 1 in late May or early June and remain high until August. Chlorophyll a concentrations then decline from August to October and remain generally low until the following spring (Foe et al. 2002). Chlorophyll a concentrations in the San Joaquin River near Vernalis ranged from 5 to 75 µg/L during the summer and fall in 2000 and 2001. Pheophytin concentrations, an indication of dead algal biomass, remained below the chlorophyll a concentrations for most of 2001, except during the largest algal blooms in the San Joaquin River (Foe et al. 2002). Algal pigment is the sum of measured chlorophyll and pheophytin pigments. As shown in Figure 2 (above), algal pigment concentrations in the San Joaquin River at Maze and Patterson are greatest from June through September. Algal pigment concentrations in the rivers eastside tributaries are substantially less than the concentrations in the mainstem San Joaquin River during the summer and are relatively constant throughout the year (Figure 2). One study suggests that flow from the eastside rivers, the Tuolumne, Merced, and Stanislaus Rivers, may be diluting algal concentrations in the San Joaquin River because algal concentrations in these flows are low (Foe et al. 2002). However, despite the low algal concentrations in the eastside river flows, chlorophyll a concentrations at upstream and downstream locations in Reach 1 were similar during 2000 and 2001 (Kratzer et al. 2004). This similarity suggests that algal growth in the river downstream from the tributary inflow compensates for the dilution. Light is assumed to be a limiting factor to algal growth in the San Joaquin River (Foe et al. 2002, Leland et al. 2001) because nutrient concentrations are substantially greater than those concentrations that would limit algal growth (Lee and Jones-Lee 2003). Predation by zooplankton and clams may also affect algal (phytoplankton) concentrations in Reach 1 (Lee and Jones-Lee 2003). Diversions from the San Joaquin River, including those in Reach 1, can remove large volumes of algal biomass (Quinn and Tulloch 2002) but will not change the river concentration of algae. Patterson Irrigation District, West Stanislaus Irrigation District, El Solyo Water District, and Del Puerto Water District are the major diverters downstream from the Merced River. Most agricultural diversions typically occur during AprilSeptember (Quinn and Tulloch 2002). Nonalgal sources of CBOD in Reach 1 include agricultural irrigation drainage, agricultural stormwater runoff, riparian vegetation, urban dry season runoff, urban wastewater drainage, and dairy and animal husbandry areas (Roberson and Wolf 2004, Lee and Jones-Lee 2000). One study estimated the concentrations of nonalgal organic particles at Vernalis by subtracting algal biomass concentrations from VSS concentrations (for their water quality model inputs). The estimated concentrations of nonalgal organic matter generally ranged from 2 to 4 mg/L (Brown 2002). These concentrations represent approximately 10% to as much as 50% of the VSS concentrations at Vernalis (Brown 2002). The relative importance of other sources of organic matter to BOD concentrations in Reach 1 is not specifically identified in the literature. Wastewater treatment plants (a potential source of other organic matter) may account for only 23% of the BOD load at Vernalis during the summer (Quinn and Tulloch 2002). Because chlorophyll a (algal biomass) accounted for 7076% (see Algal Biomass section above) of the variation in BOD10 measurements (Foe et al. 2002) in Reach 1, other sources of organic matter in Reach 1 may contribute less than 2530% to BOD concentrations. Jump to "BOD Concentration > Secondary Driver—Carbonaceous BOD Concentrations" under:
Reach 2 |
Reach 3 Secondary DriverNitrogenous Biochemical Oxygen Demand Concentrations NBOD (ammonia) concentrations in Reach 1 are generally low. One study found that ammonia concentrations were below the laboratory reporting levels (0.04 mg/L as N) in approximately 59 of 130 samples collected at San Joaquin River sites at or upstream of Vernalis (Kratzer et al. 2004). Maximum San Joaquin River ammonia concentrations were 0.58 mg/L and 0.53 mg/L as N in 2000 and 2001, respectively (Kratzer et al. 2004). Los Banos Creek, Salt Slough, the San Luis Drain, and the Harding Drain (which receives City of Turlock Wastewater Treatment Plant effluent) generally discharged the highest ammonia concentrations to the San Joaquin River during 2000 and 2001 (Kratzer et al. 2004). The Tuolumne, Stanislaus, and Merced Rivers typically contributed low ammonia concentrations (Kratzer et al. 2004). Point sources of ammonia to Reach 1 include domestic wastewater discharges (Lee and Jones-Lee 2000). Nonpoint ammonia sources in Reach 1 include dairies, agricultural operations, wetlands, and the instream conversion of organic nitrogen to ammonia via ammonification. The relative importance of NBOD to total BOD concentration in Reach 1 is not specifically identified in the literature. Jump to "BOD Concentration > Secondary Driver—Nitrogenous BOD Concentrations" under:
Reach 2 |
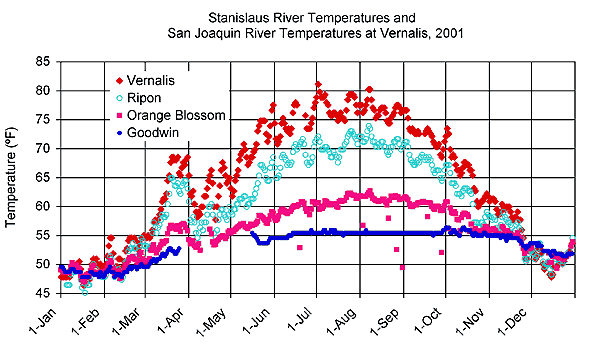
Reach 3 Secondary DriverWater Temperature The figure below displays water temperatures at different locations in one of the Reach 1 eastside tributaries, the Stanislaus River. As the water flows from upstream locations to downstream locations (Goodwin to Orange Blossom to Ripon) on the Stanislaus River, the water temperatures increase and approach the warmer temperatures of the San Joaquin River at Vernalis. A similar trend occurs in the other eastside tributaries to Reach 1 of the San Joaquin River. Along the San Joaquin River itself, temperatures do not increase as the river flows downstream because the equilibrium temperature, which is governed by the seasonal meteorological conditions, has been reached.
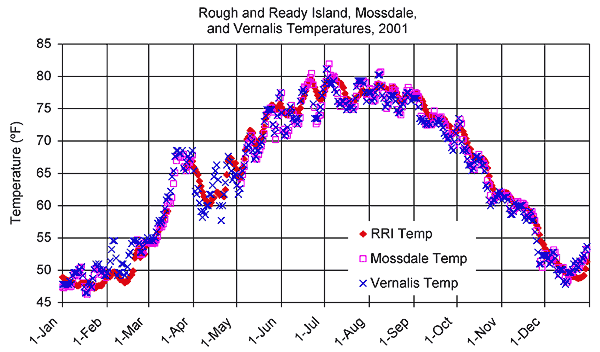
Water temperatures in Reach 1 (at Vernalis) ranged from less than 50°F (10°C) to greater than 77°F (25°C) in 2001 (Brown 2002). In portions of June, July, and August, water temperatures in the San Joaquin River were greater than 77°F (25°C) (Brown 2002). The coldest temperatures (less than 50°F [10°C]) were recorded only in January, early February, and December (Brown 2002). As shown in the figure below, water temperatures in Reach 1 (at Vernalis) were very similar to temperatures in Reaches 2 (Mossdale) and 3 (Rough and Ready Island).
Ambient air temperature, temperature of water entering Reach 1, and residence time are the primary factors affecting water temperature. Jump to "BOD Concentration > Secondary Driver—Water Temperature" under:
Reach 2 |
Reach 3 Uncertainties in Biochemical Oxygen Demand Concentrations Uncertainties related to understanding how BOD concentrations in Reach 1 may affect DO concentrations in the DWSC include:
Research needs identified in relevant literature are directed toward:
Jump to "BOD Concentration > Uncertainties in BOD Concentrations" under:
Reach 2 |
Reach 3 |