|
Current location: Home > Physical Processes Model > Reach 3 > Primary DriverBOD Concentration |
|
Reach 3: Primary Driver—BOD Concentration
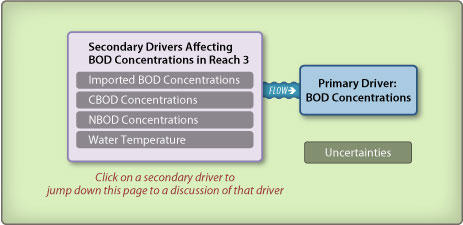
BOD concentrations in Reach 3 (i.e., the DWSC) are affected by the four secondary drivers shown above. Click on a secondary driver to jump down to the discussion of that driver. See the Basic Concepts page for a general discussion of how the secondary drivers affect the primary driver. In the DWSC, concentrations of BOD vary by flow and location. BOD10 and BOD5 concentrations are typically higher during ebb flows than flood flows (Lehman 2003). Generally, the greatest BOD concentrations occur at Channel Point and continue to decrease downstream. From Channel Point to Turner Cut, BOD5 concentrations generally decreased by approximately 0.5 mg/L on average during 2000 and 2001 (Jones & Stokes 2001a and 2002c). In 2001, BOD10 concentrations at Navigation Light 48 and the Rough and Ready Island monitoring station ranged from approximately 4.5 to 8 mg/L and generally peaked in September and October (Lehman 2003). BOD5 concentrations during this period at these locations also peaked in September and ranged from approximately 3 to 6 mg/L (Lehman 2003). Both BOD5 and BOD10 concentrations at Turner Cut were typically less than 2 mg/L (Lehman 2003). Secondary DriverImported Biochemical Oxygen Demand Concentration The available information suggests that BOD concentrations contributed from Reach 2 are the primary factor affecting DO concentrations in Reach 3 (Lehman 2003). Direct sources of BOD to Reach 3 include the San Joaquin River and local sources from Smith Canal, the Calaveras River, Fourteen Mile Slough, and the Turning Basin. The San Joaquin River where it enters the DWSC at Channel Point is the greatest source of BOD to the DWSC (Lehman and Ralston 2001). One author found that at least 60% of the NBOD and CBOD in the DWSC at Light 43 (near Rough and Ready Island) was derived from the San Joaquin River (Lehman and Ralston 2001). The San Joaquin River also contributed 65% of the organic carbon, at least 70% of the ammonia load, and 4060% of the VSS at Light 43 (Lehman and Ralston 2001). Imported NBOD is an important component of the BOD affecting DO concentrations in the DWSC. One author found that approximately 5080% of the BOD in the DWSC is nitrogenous and that BOD in the DWSC is highly correlated with ammonia (Lehman et al. 2001). Therefore, nitrogenous (ammonia and organic nitrogen) inputs from the Stockton RWCF are a major factor affecting BOD variations in the DWSC (Lehman 2003) and DO concentrations in the DWSC. The relative contribution of the RWCF inputs to the DWSCs BOD compared to the upstream San Joaquin River BOD sources is a function of total load, load composition, ammonification rates, and residence time (Lehman 2003). Limited BOD data are available for Smith Canal, Fourteen Mile Slough, and the Calaveras River. Chlorophyll a concentrations were higher in Smith Canal and the Turning Basin than at Channel Point or the Calaveras River in 1999 ( Lehman and Ralston 2001). The Turning Basin could be a source or a sink of BOD. The available information suggests that BOD concentrations contributed from Reach 2 are the primary factor affecting DO concentrations in Reach 3 (Lehman 2003). Although a large portion of the imported particulate BOD load settles in the DWSC (Litton 2003), most of the BOD in the DWSC is soluble (Litton and Nakaido 2001) and therefore could still affect the DO concentrations in the water column of the DWSC. Because ammonia is an important source of BOD to the DWSC (Lehman et al. 2001, Lehman and Ralston 2001), the Stockton RWCF inputs to Reach 2, and thereby the ammonia contributed from Reach 2 to Reach 3, support the importance of imported BOD concentrations. In addition, higher BOD concentrations near Channel Point than at DWSC locations farther downstream ( Lehman 2003) indicate that imported BOD is an important factor affecting BOD concentrations in the DWSC. Jump to "BOD Concentration > Secondary Driver—Imported BOD Concentrations" under:
Reach 1 |
Reach 2 Secondary Driver—Carbonaceous Biochemical Oxygen Demand Concentrations Algal Biomass Algae may be an important source of oxygen demand in the DWSC. The high concentrations of pheophytin relative to chlorophyll a concentrations in the DWSC and its tributaries suggest that decaying algal biomass contributes significantly to oxygen demand in the DWSC (Lehman and Ralston 2001). The figure below shows these higher ratios of pheophytin concentrations relative to chlorophyll concentrations in the DWSC. Measurements of both chlorophyll and pheophytin are generally greater at the farthest upstream location (R3) compared to concentrations at the other monitoring locations. This trend highlights the importance of imported algae from the San Joaquin River on algae concentrations in the DWSC.
Algal loads in the DWSC may be derived from growth in the DWSC and from sources upstream ( Lehman et al. 2001, Chen and Tsai 2002). An additional source of algae to the DWSC is the Turning Basin (Lehman and Ralston 2001). Nutrients in the DWSC are an order of magnitude above limiting levels for algal growth (Lehman 2003) and are derived from wastewater and agricultural runoff (Hunt 2002). Thus, substantial algal productivity may occur in the DWSC (Jones & Stokes 2002a). Pheophytin and chlorophyll a concentrations indicate that most of the algae entering the DWSC from the San Joaquin River at Channel Point is already decaying (Lehman and Ralston 2001). Immediately after entering the DWSC, approximately 60% of the pheophytin (Lee and Jones-Lee 2003) and 60% of the chlorophyll a (Litton 2003) settles out of the water column and begins to decompose. Light is assumed to be a primary limiting factor to algae growth in the DWSC (Lehman et al. 2001, Jones & Stokes 2002a, Lehman 2003, and Chen and Tsai 2002) because required nutrients (nitrogen, phosphorus, silica) for algal growth are an order of magnitude above limiting levels (Lehman 2003). The photic zone (1% surface light) in the DWSC is generally restricted to a depth of 2 meters (6.6 feet) below the water surface because of high turbidity (Lehman et al. 2001). The relative importance of algal growth to BOD concentrations in Reach 3 is not fully known. Algae entering the DWSC from upstream are typically diatoms. These small disk-shaped unicellular algae are solitary, free-floating organisms that depend on turbulence to move through the water column (Van Nieuwenhuyse 2002). When diatoms enter the DWSC, they may be unable to sustain a place in the photic zone (Van Nieuwenhuyse 2002). Measured settling velocities of both chlorophyll a and pheophytin were quite high, though the chlorophyll a settling velocities were lower than those for pheophytin (Litton 2003). This difference is likely caused by the ability of algae to regulate their position in the water column (Litton 2003). Algae produced in the DWSC are predominately Chlamydomonas and other flagellated forms. Although these organisms are able to move to maintain position in the photic zone and adjust to temperature gradients (Van Nieuwenhuyse 2002), decreasing chlorophyll a concentrations between Channel Point and Turner Cut indicate a portion of the algae load in Reach 3 settles out of the water column (Jones & Stokes 2001a; Lehman et al. 2001). In addition, algal biomass is also affected by the time available for algae to grow in the study area. For example, increased algal biomass in the DWSC will generally occur during periods of increased residence times (Quinn and Tulloch 2002). Nonalgal Biomass Nonalgal sources of CBOD in Reach 3 include inputs from the Turning Basin (Lehman and Ralston 2001) and from Reach 2. The quantity and importance of nonalgal biomass sources in the DWSC have not been described in the literature. Important factors affecting nonalgal biomassrelated BOD concentrations in Reach 3 are not identified in the literature. However, river flows and residence time in the DWSC likely affect the organic matter sources by affecting the quantity of organic matter entering the DWSC from Reach 2 and the amount of time available for the organic matter to be consumed. In addition, water temperatures in Reach 3 could affect the concentration of organic matter by affecting the decomposition or ammonification rates of the organic matter. Jump to "BOD Concentration > Secondary Driver—Carbonaceous BOD Concentrations" under:
Reach 1 |
Reach 2 Secondary DriverNitrogenous Biochemical Oxygen Demand Concentrations Sources of NBOD (ammonia) to the DWSC include ammonification (decay) of organic nitrogen in the DWSC (Lehman et al. 2001) and imported dissolved ammonia from sources upstream, including the Stockton RWCF. During the fall and winter, stormwater runoff to the DWSC from the Stockton area may be another source of ammonia to the DWSC (Lee and Jones-Lee 2003). BOD concentrations are correlated with dissolved ammonia concentrations in the DWSC (Lehman 2003). Ammonia comprises 60% of the BOD in the DWSC (Lehman 2003) but is not an important contributor of BOD in the Turning Basin (Lehman et al. 2001). Ammonia concentrations at City of Stockton monitoring stations R3R6 in the DWSC are shown in the figure below. The concentrations are generally lowest during the summer and highest from December through February. This variation in the concentrations is a result, in part, of the variation in the Stockton RWCFs discharge ammonia concentration and the dilution flow provided by the San Joaquin River. The RWCF ammonia is generally lowest in the summer, when algae growth in the oxidation ponds is greatest. The highest ammonia concentrations typically occur at the farthest upstream locations (R3 and R4), which indicate that the RWCF is the primary source of ammonia to the DWSC.
Discharges of ammonia from the Stockton RWCF into the downstream end of Reach 2 of the San Joaquin River can substantially affect NBOD concentrations in the DWSC (Lee and Jones-Lee 2003, Lehman et al. 2001, Lehman 2003, Hunt 2002). The relative contribution of the RWCF inputs to the DWSCs BOD compared to the upstream San Joaquin River BOD sources is a function of total load, load composition, ammonification rates, and residence time (Lehman 2003). One author determined the correlation between ammonia from the RWCF and ammonia and NBOD in the DWSC was stronger than the correlation between the upstream organic nitrogen load and ammonia and NBOD in the DWSC (Lehman 2003). Another author suggests that additional studies should be conducted to determine whether the RWCF ammonia discharges are subject to enhanced nitrification rates, which would lead to a greater proportion of the ammonia being oxidized in Reach 3 (Lee and Jones-Lee 2003). The RWCF is adding a nitrification facility that will substantially reduce the effluent concentration of ammonia to about 2 mg/L by the fall of 2006. Factors affecting ammonia-related BOD concentrations include the total load, ammonification rate, and residence time (Lehman 2003) in the DWSC. Water temperatures indirectly affect the ammonia concentrations by affecting the ammonification and nitrification rates. Nitrification rates in the DWSC are significantly less at colder winter temperatures (Lee and Jones-Lee 2003). Shorter residence times allow less time for organic nitrogen to be converted to ammonia (Lee and Jones-Lee 2003). Jump to "BOD Concentration > Secondary Driver—Nitrogenous BOD Concentrations" under:
Reach 1 |
Reach 2 Secondary DriverWater Temperature Ambient air temperature is the primary factor affecting water temperature in Reach 3. Although the available information suggests that water temperature is a factor affecting BOD concentrations in Reach 3, it is unknown how important water temperature is to the Reach 3 BOD concentrations. The water temperature conditions in Reach 3 are described below. As shown in the figure below, water temperatures in Reach 3 (Rough and Ready Island) are generally very similar to temperatures in Reaches 1 (Vernalis) and 2 (Mossdale). Water temperatures in the upstream portions of Reach 3 (i.e., near Channel Point) are slightly higher than temperatures in the downstream portion of the reach (i.e., near Disappointment Slough) (Lehman and Ralston 2001). Near surface water temperatures in the DWSC are slightly higher (0.51°C) than temperatures near the bottom during the day in July and August (Jones & Stokes 2001a). However, the DWSC is generally well mixed at night, and substantial temperature stratification typically does not occur (Jones & Stokes 2002a; Jones & Stokes 2001a).
Seasonally, water temperatures in the DWSC are generally greater than 77°F (25°C) in the summer and less than 50°F (10°C) during the winter (Lehman and Ralston 2001). Surface water temperatures in the Turning Basin are slightly higher than temperatures in the DWSC (Lehman 2003). In addition, Turning Basin water temperatures are generally more stratified (2°C difference between surface and bottom temperatures) than in the DWSC (Lehman 2003). Jump to "BOD Concentration > Secondary Driver—Water Temperature" under:
Reach 1 |
Reach 2 Uncertainties in Biochemical Oxygen Demand Concentrations Uncertainties related to understanding how BOD may contribute to low DO concentrations in the DWSC include:
Jump to "BOD Concentration > Uncertainties in BOD Concentrations" under:
Reach 1 |
Reach 2 |