|
Current location: Home > Physical Processes Model > Reach 2 > Primary DriverBOD Concentration |
|
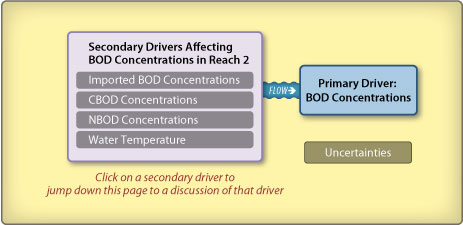
Reach 2: Primary Driver—BOD Concentration
BOD concentrations in Reach 2 are affected by the four secondary drivers shown above. Click on a secondary driver to jump down to the discussion of that driver. See the Basic Concepts page for a general discussion of how the secondary drivers affect the primary driver. Generally, BOD10 and BOD5 measurements at Channel Point and Mossdale in Reach 2 were very similar. Based on data collected in JuneOctober 2001, Reach 2 BOD10 values ranged from approximately 6 to 10 mg/L. BOD5 values during this period ranged from 2 to 6 mg/L. At Channel Point, ebb tide BOD10 measurements were generally greater than BOD10 flood tide measurements. Ebb tide and flood tide BOD5 measurements were very similar. (Lehman 2003). Secondary Driver—Imported Biochemical Oxygen Demand Concentration Potential sources of imported BOD to the San Joaquin River in Reach 2 include the Stockton RWCF, return flows from agricultural diversions, surface or subsurface runoff from mobile home parks, stormwater discharges, groundwater discharges (Quinn and Tulloch 2002), and the San Joaquin River upstream of Vernalis (Reach 1). In addition, during flood tides, BOD in the DWSC (Reach 3) can be transported upstream (at least 3 miles from Channel Point) into Reach 2 (Lehman 2003). It is estimated that agricultural return flows account for a maximum input of 75 cfs to Reach 2 during the summer (Quinn and Tulloch 2002), but the potential BOD concentrations in these flows are unknown. The potential BOD contribution by groundwater accretion, stormwater discharges, or inputs from the mobile home parks to Reach 2 is also unknown (Quinn and Tulloch 2002). The most substantial known sources of BOD to Reach 2 are inputs from Reach 1 and the Stockton RWCF. One study found that the ultimate BOD from the RWCF was almost always less than the ultimate BOD contributed from the San Joaquin River (Brown 2002). Reach 1 BOD concentrations entering Reach 2 at Vernalis ranged from 2.1 to 7.2 mg/L during JulyOctober 2001 and were generally highest during July and August (Foe and McCarthy 2002). The average monthly total BOD discharged into Reach 2 by the Stockton RWCF in 2000 ranged from 3.4 to 13.4 mg/L (Jones & Stokes 2001a). In 2001, the average monthly total BOD in the Stockton effluent ranged from 5.6 to 12.4 mg/L (Jones & Stokes 2002a). Generally, during both years, the lowest concentrations occurred from May through September (Jones & Stokes 2002a; Jones & Stokes 2001a). Based on water quality samples collected in summer and fall 2001, the concentrations of water quality constituents at Channel Point generally vary between ebb and flood tides (Lehman 2003). Ebb tide concentrations of BOD, CBOD, chlorophyll a, pheophytin, dissolved ammonia, and VSS were generally higher than the flood tide concentrations (Lehman 2003). Factors affecting the BOD concentration imported from Reach 1 are described in Reach 1: Biochemical Oxygen Demand. The Stockton RWCF BOD concentrations are relatively constant throughout the year (Jones & Stokes 2002a); therefore, no known factors are affecting the concentration throughout the year. The importance of imported BOD concentrations to the BOD concentration in Reach 2 is uncertain because it depends on many factors. For example, water diversions at Old River may substantially reduce the importance of Reach 1 BOD inputs to Reach 2 and increase the importance of Stockton RWCF inputs or BOD inputs from algae grown in Reach 2. Algal biomass dynamics in Reach 2, including the potential settling and decay of algae and organic materials, are not well understood and may be another factor affecting the importance of Reach 1derived BOD loads in Reach 2 (Jones & Stokes 2001a, Stringfellow and McGahan 2003). The slow decay rate of Reach 1 organic nitrogen loads to dissolved ammonia in Reach 2 (Lehman 2003) would affect the importance of Reach 1 as a source of oxygen-demanding substances (i.e., ammonia) to Reach 2. This slow decay rate may also increase the importance of the ammonia concentrations discharged from the RWCF. The effects of the Stockton RWCF inputs on Reach 2 BOD concentrations are affected by river flows. Because the RWCF is located at the downstream end of Reach 2, concentrations of BOD from the RWCF effluent are diluted by San Joaquin River flows in Reach 2 (Brown 2002; Jones & Stokes 2002b). When flows are low, ammonia concentrations in Reach 2 are higher. Seasonal increases in ammonia concentrations have been widely reported (Lee and Jones-Lee 2003; Hunt 2002; Lehman et al. 2001; Lehman 2003). One study suggests that when river flows are 300 cfs or less, the effects of the RWCF discharge on Reach 3 BOD concentrations are far more significant than when flows are 800 cfs or greater (Lee and Jones-Lee 2003) because the lower flows provide less dilution of the discharge (Brown 2002). Jump to "BOD Concentration > Secondary Driver—Imported BOD Concentrations" under:
Reach 1 |
Reach 3 Secondary Driver—Carbonaceous Biochemical Oxygen Demand Concentrations Algal Biomass Algal biomass in Reach 2 depends on algae produced in Reach 2 and algal biomass contributed from Reach 1. In Reach 2, chlorophyll a (algae) concentrations were always higher (and sometimes substantially higher) at Mossdale than at Channel Point during summer and fall 2001 (Lehman 2003). These higher values at Mossdale indicate that other factors, such as algal settling and decay or flow diversions, are affecting the chlorophyll a concentrations between Mossdale and Channel Point. The figure below compares 2002 algal concentrations in the San Joaquin River at Mossdale and Vernalis to concentrations at Buckley Cove in the DWSC. Mossdale generally appears to have higher algal concentrations than Vernalis during JuneSeptember. The concentrations at all three locations indicate that the rivers characteristics (i.e., relatively shallow depths, high velocities, and sufficient light) are more suitable for algal growth, particularly during the summer, than the DWSCs characteristics.
The primary sources of nutrients supporting algal growth in Reach 2 are the Stockton RWCF and agricultural discharges and drainage entering Reach 1 (Hunt 2002). In addition to providing nutrients, the RWCF is a source of CBOD loads to Reach 2 (Gowdy and Grober 2004). Approximately half of the BOD discharged by the RWCF is CBOD (Jones & Stokes 2001a). As indicated by measurements of VSS and CBOD in the RWCF effluent, most of the CBOD is from VSS (i.e., particulates) (Jones & Stokes 2002b). Because the RWCF uses oxidation ponds (with a 30-day residence time) as its secondary treatment, all of the VSS that passes through the RWCFs air flotation treatment and sand filters is derived from algae growing in the oxidation ponds (Jones & Stokes 2002b). Therefore, most of the measured CBOD loads from the RWCF are algal derived. CBOD concentrations from the RWCF and the San Joaquin River are generally highest from June through September (Brown 2002; Jones & Stokes 2002b). For example, during August 1999, the RWCF discharged 3,000 lbs/day of CBOD (Lee and Jones-Lee 2000). In 2001, CBOD loads from the RWCF ranged from 500 to 2,500 lbs/day, depending on discharge flow ( Jones & Stokes 2002a). The average CBOD load during JuneOctober 2001 was approximately 800 lbs/day (Jones & Stokes 2002a). The limiting factor to algal growth in the San Joaquin River is assumed to be light (Foe and McCarthy 2002; Leland et al. 2001) because nutrient concentrations are substantially greater than those concentrations that would limit algal growth (Lee and Jones-Lee 2003). Other factors affecting algal-related BOD in Reach 2 include algae and nutrients contributed from Reach 1, discharge of algae from the Stockton RWCF, and diversions. One study found that CBOD loads from the RWCF varied with the RWCF discharge flow (Jones & Stokes 2002a). Diversions from Reach 2, including from Old River, can also remove large volumes of algal biomass (Quinn and Tulloch 2002). Total BOD5 and CBOD5 measurements in summer and fall 2001 indicate that CBOD5 generally makes up at least half of the BOD5 measured at Channel Point and at Mossdale (Figures III-6e and III-6f in Lehman 2003). These measurements suggest that algal biomass is an important contributor to BOD concentrations in Reach 2. Additional support that algal biomass is an important contributor to BOD concentrations in Reach 2 is shown in the figure below.
Although few BOD measurements have been collected in Reach 2, VSS has been measured and is approximately equivalent to BOD. The Reach 2 VSS concentrations at Vernalis and Mossdale (see figure above) follow the seasonal patterns of algal concentrations at those locations. Namely, both the algal and VSS concentrations increase during JuneSeptember, indicating that the Reach 2 VSS concentrations and, therefore, BOD concentrations are strongly affected by algal concentrations. However, the slow ammonification rate of organic nitrogen in Reach 2 (Lehman 2003) may indicate that ammonia inputs from the Stockton RWCF are also an important contributor to the BOD concentrations in Reach 2. Nonalgal Biomass Nonalgal sources of CBOD in Reach 2 include organic nitrogen compounds discharged from the Stockton RWCF (Gowdy and Grober 2004) and from other organic matter contributed from Reach 1. One study estimated the concentrations of nonalgal sources of CBOD at Mossdale by subtracting algal biomass concentrations from VSS concentrations in their water quality model. The estimated concentrations of nonalgal sources of CBOD are generally in the range of 24 mg/L but may be as much as 8 mg/L (Brown 2002). These concentrations represent approximately 1050% of the VSS concentrations at Mossdale (Brown 2002). Important factors affecting other nonalgal sources of CBOD–related BOD concentrations in Reach 2 are not identified in the literature. The relative importance of nonalgal sources of CBOD to BOD concentrations in Reach 2 is not specifically identified in the literature. However, it is unlikely that nonalgal sources of CBOD are greater contributors to BOD in Reach 2 than algae or ammonia sources. Jump to "BOD Concentration > Secondary Driver—Carbonaceous BOD Concentrations" under:
Reach 1 |
Reach 3 Secondary Driver—Nitrogenous Biochemical Oxygen Demand Concentrations Factors affecting the ammonia-related BOD concentration in Reach 2 include the quantity of organic nitrogen (algae) contributed from Reach 1, the ammonification rate in Reach 2, the residence time in Reach 2, the efficiency of the Stockton RWCF treatment system in removing ammonia, and the river flows. Increased algal loads into Reach 2 from Reach 1 increase the potential quantity of ammonia-related BOD in Reach 2 that could be derived via ammonification. Another factor affecting ammonia-related BOD concentrations is the ammonification rate in Reach 2, which is slow and prevents a portion of the organic nitrogen inputs from Reach 1 from being converted to dissolved ammonia in Reach 2 (Lehman 2003). This ammonification rate depends on water temperatures, which could therefore indirectly affect the ammonia-related BOD concentrations. The Stockton RWCF is a primary source of ammonia in Reach 2 (Gowdy and Grober 2004). Average monthly ammonia as nitrogen concentrations in the RWCF effluent ranged from 1.2 to 26.0 mg/L in 2000 (Jones & Stokes 2001a) and from 4.3 to 24.8 mg/L in 2001 (Jones & Stokes 2002a). Generally, the highest Stockton RWCF ammonia concentrations occur in January and February, and the lowest concentrations occur in AprilJune (Jones & Stokes 2001a; Jones & Stokes 2002a). Approximately half of the BOD discharged by the RWCF is NBOD (Jones & Stokes 2001a). It should be noted that the 5-day NBOD is only a portion of the total nitrification demand for oxygen. NBOD concentrations from the RWCF and the San Joaquin River are generally highest from June through September (Brown 2002; Jones & Stokes 2002b). Loads of NBOD discharged by the RWCF into Reach 2 varied from approximately 3,800 to 28,000 lbs/day in 2001 (Jones & Stokes 2002a) and 800 to 29,500 lbs/day in 2000 (Jones & Stokes 2001a). Reach 1 inflows are another source of ammonia to Reach 2. Ammonia inputs from Reach 1 to Reach 2 are shown in Reach 1: Biochemical Oxygen Demand, Secondary DriverNitrogenous Biochemical Oxygen Demand Concentrations. The ammonia concentrations from Reach 1 (less than 0.02 to 0.04 mg/L) are substantially less than the Stockton RWCF concentrations (1.2 to 26.0 mg/L). In general, the RWCF discharged greater daily dissolved ammonia loads than Reach 1 (Lehman et al. 2004). River flows can affect ammonia-related BOD concentrations by affecting the Reach 1 organic nitrogen inputs and the amount of time available for ammonification to occur in Reach 2 and by diluting dissolved ammonia loads from the Stockton RWCF. The Stockton RWCF uses algae in its treatment system to remove nutrients (including ammonia) from the RWCF wastewater (Jones & Stokes 2002b). During the winter, when temperatures are colder and less sunlight is available than during the summer, the algae are not as effective at removing ammonia (Jones & Stokes 2002b). The substantially higher RWCF ammonia concentrations in the winter compared to the summer (Jones & Stokes 2001a) are indicative of variations in the effectiveness of the RWCF treatment system. Total BOD5 and CBOD5 measurements in summer and fall 2001 indicate that CBOD5 generally makes up at least half of the BOD5 measured at Channel Point and at Mossdale (Figures III-6e and III-6f in Lehman 2003). These measurements suggest that ammonia may be a less significant contributor to BOD concentrations in Reach 2 than algal inputs. The high ammonia concentration discharged by the RWCF suggests that ammonia concentrations in Reach 2 may be an important contributor to the BOD concentrations in that reach during the winter. Jump to "BOD Concentration > Secondary Driver—Nitrogenous BOD Concentrations" under:
Reach 1 |
Reach 3 Secondary Driver—Water Temperature Ambient air temperature, temperature of water entering Reach 2, and residence time are the primary factors affecting water temperature. Based on the seasonal temperatures, BOD decay processes are highest in summer and lowest in winter in Reach 2 (Brown 2002). The literature does not describe the importance of water temperature on the BOD concentrations in Reach 2 or compare the importance of temperature to other factors affecting BOD concentrations. The water temperature conditions in Reach 2 are described below. Water temperatures in Reach 2 (at Mossdale) ranged from less than 50°F (10°C) to greater than 68°F (20°C) in 2001 (Brown 2002). In portions of June, July, and August, water temperatures in the San Joaquin River were greater than 77°F (25°C) (Brown 2002). The coldest temperatures (less than 10°C) were recorded only in January, early February, and December (Brown 2002). As shown in the figure below, water temperatures in Reach 2 (Mossdale) are very similar to temperatures in Reaches 1 (Vernalis) and 3 (Rough and Ready Island).
Jump to "BOD Concentration > Secondary Driver—Water Temperature" under:
Reach 1 |
Reach 3 Uncertainties in Biochemical Oxygen Demand Concentrations Uncertainties related to understanding how BOD concentrations in Reach 2 may affect DO concentrations in the DWSC include:
Research needs identified in relevant literature are directed toward:
Jump to "BOD Concentration > Uncertainties in BOD Concentrations" under:
Reach 1 |
Reach 3 |