|
Current location: Home > Physical Processes Model > Reach 3 > Primary Driver—Sediment Oxygen Demand |
|
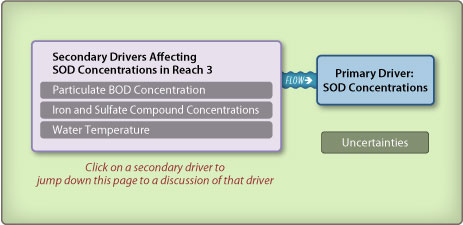
Reach 3: Primary Driver—Sediment Oxygen Demand
The SOD in Reach 3 (i.e., the DWSC) is affected by the three secondary drivers shown above. Click on a secondary driver to jump down to the discussion of that driver. For example, if the SOD is uniform in the DWSC, the residence time can be used to estimate the expected DO decline as the water flows across the sediments during each day of travel. For the DWSC with a depth of about 10 m (33 feet), a SOD of 1 g/m2-day will reduce the DO concentration by 0.1 mg/L each day. Often, however, the rate of reaeration (g/m2-day) across the nearly equal area of water surface will be greater than the SOD rate, so there may be no measured decline in DO along the river reach. However, there is no direct way to distinguish between DO declines caused by algal respiration, bacterial decay, or nitrification (i.e., BOD) and SOD. Reaeration and algal photosynthesis are also unmeasured. The conceptual model allows both sources of oxygen demands, although the relative magnitude of these sediment and suspended sources are uncertain. Secondary Driver—Particulate Biochemical Oxygen Demand Concentration Particulate BOD in Reach 3 is a result of algae produced in Reach 3 and algal biomass and other sources of organic matter contributed from Reach 2 or the Smith Canal, Fourteen Mile Slough, and the Calaveras River. Based on particulate BOD fractions measured in the DWSC and at Vernalis, approximately 55% of BOD entering and in the DWSC was particulate (Litton 2003). The similar particulate BOD fractions indicate that the San Joaquin River is the most important source of particulate BOD (and therefore SOD) to the DWSC. Other studies also support that BOD entering the DWSC at Channel Point from the San Joaquin River is the greatest source of BOD in the DWSC (Lehman and Ralston 2001). The San Joaquin River contributed 4060% of the VSSs at Light 43 (Lehman and Ralston 2001). The particulate BOD concentration in the DWSC is related to:
Resuspension is a significant factor affecting particulate concentrations in the water column of the DWSC, particularly downstream of Light 43, where net settling rates are approximately equal to resuspension rates, as indicated by steady concentrations of VSS and TSS (Litton 2003). The quantity of particulates that settle to the bottom of the DWSC would be expected to increase with increasing inputs of particulate BOD (including algae) to the DWSC from the San Joaquin River. Particle aggregation upon settling may affect the particulate settling velocities following resuspension (Litton 2003). Jump to "SOD Concentrations > Secondary Driver—Particulate Biochemical Oxygen Demand Concentration" under:
Reach 1 |
Reach 2 Secondary Driver—Iron and Sulfate Compound Concentrations Iron and sulfate compound concentrations in the sediments of Reach 3 have not been measured. Jump to "SOD Concentrations > Secondary Driver—Iron and Sulfate Compound Concentrations" under:
Reach 1 |
Reach 2 Secondary Driver—Water Temperature The figure below shows that water temperatures in Reach 3 (Rough and Ready Island) are generally very similar to temperatures in Reaches 1 (Vernalis) and 2 (Mossdale). Near surface water temperatures in the DWSC are slightly higher (0.5 to 1°C) than temperatures near the bottom during July and August (Jones & Stokes 2001a). However, the DWSC is generally well-mixed, and substantial temperature stratification typically does not occur (Jones & Stokes 2002a; Jones & Stokes 2001a). Turning Basin temperatures are generally more stratified (2ºC difference between surface and bottom temperatures) than in the DWSC (Lehman 2003).
Ambient air temperature is the primary factor affecting water temperature in Reach 3. Although the available information suggests that water temperature is a factor affecting SOD rates in Reach 3, it is unknown how important water temperature is on the Reach 3 SOD rates. The water temperature conditions in Reach 3 are described below. As shown in the figure above, water temperatures in Reach 3 (Rough and Ready Island) are generally very similar to temperatures in Reaches 1 (Vernalis) and 2 (Mossdale). Water temperatures in the upstream portions of Reach 3 (i.e., near Channel Point) are slightly higher than temperatures in the downstream portion of the reach (i.e., near Disappointment Slough) (Lehman and Ralston 2001). Near surface water temperatures in the DWSC are slightly higher (0.51°C) than temperatures near the bottom during the day in July and August (Jones & Stokes 2001a). However, the DWSC is generally well mixed at night, and substantial temperature stratification typically does not occur (Jones & Stokes 2002a; Jones & Stokes 2001a). Seasonally, water temperatures in the DWSC are generally greater than 77°F (25°C) in the summer and less than 50°F (10°C) during the winter (Lehman and Ralston 2001). Surface water temperatures in the Turning Basin are slightly higher than temperatures in the DWSC (Lehman 2003). In addition, Turning Basin water temperatures are generally more stratified (2°C difference between surface and bottom temperatures) than in the DWSC (Lehman 2003). Jump to "SOD Concentrations > Secondary Driver—Water Temperature" under:
Reach 1 |
Reach 2 Uncertainties related to understanding how SOD concentrations may affect dissolved oxygen concentrations in the DWSC include:
Jump to "SOD Concentrations > Uncertainties in SOD" under:
Reach 1 |
Reach 2 |