|
Current location: Home > Physical Processes Model > Reach 1 > Primary DriverSOD Concentrations |
|
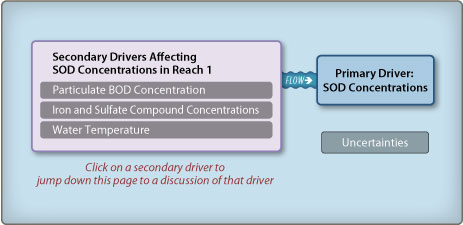
Reach 1: Primary Driver—SOD Concentrations
The SOD in Reach 1 is affected by the four secondary drivers shown above. Click on a secondary driver to jump down to the discussion of that driver. SOD in Reach 1 has not been quantified or studied. Although it is assumed that some quantity of SOD exists in Reach 1, because SOD in this reach has not been quantified in the available literature, SOD value are unknown. By definition, SOD is the oxygen demand from the sediments (i.e., the river bed) (Chen and Tsai 2002); therefore, SOD in Reach 1 is not transportable to Reaches 2 or 3. SOD in Reach is not expected to be large or to have a significant impact on DO concentrations in Reach 1 because of the rapid river velocities that suspend and resuspend algae and particulate organic matter in the water column and prevent substantial particulate settling. Reaeration is apparently large enough to balance out SOD or BOD decay in Reach 1. Secondary DriverParticulate Biochemical Oxygen Demand Concentration Particulate BOD concentrations in Reach 1 are the result of both imported particulate BOD and algal growth in Reach 1. Settling of the particulate organic materials may contribute to SOD in Reach 1. Reach 1 particulate BOD concentrations have not been measured but may be estimated from observed algal biomass and VSS concentrations. In general, chlorophyll a concentrations (a measure of algal biomass) increase upstream of Vernalis in late May or early June and remain high until August. Chlorophyll a concentrations then decline from August to October and remain generally low until the following spring (Foe et al. 2002). Chlorophyll a concentrations in the San Joaquin River near Vernalis ranged from 5 to 75 µg/L during the summer and fall in 2000 and 2001. Pheophytin concentrations, an indication of dead algae, remained below the chlorophyll a concentrations for most of both years, except during the largest algal blooms in the San Joaquin River (Foe et al. 2002). VSS measurements in 2000 and 2001 ranged from approximately 2 to 20 mg/L at Reach 1 monitoring locations (see the figures below, created from data in Jones & Stokes San Joaquin River Data Atlas [2004]).
The majority of BOD in Reach 1 is considered to be particulate. Settling of inorganic suspended sediment (turbidity) in Reach 1 may increase the settling of organic particles that attach or adsorb to the inorganic clay particles. The contribution of settling BOD particulates to SOD in Reach 1 is unknown. Jump to "SOD Concentrations > Secondary Driver—Particulate Biochemical Oxygen Demand Concentration" under:
Reach 2 |
Reach 3 Secondary Driver—Iron and Sulfate Compound Concentrations Iron and sulfate compound concentrations (or other anaerobic chemicals) in the sediments of Reach 1 have not been measured. Factors affecting iron and sulfate concentrations in sediments of Reach 1 and their importance on SOD in Reach 1 are not identified in the literature. Jump to "SOD Concentrations > Secondary Driver—Iron and Sulfate Compound Concentrations" under:
Reach 2 |
Reach 3 Secondary Driver—Water Temperature Because SOD is the result of biochemical processes, SOD rates would be expected to be highest in summer and lowest in winter in Reach 1 ( Brown 2002). The literature does not describe the importance of water temperature on the SOD rates in Reach 1 or compare the importance of temperature to other drivers affecting SOD. Water temperatures in Reach 1 (at Vernalis) ranged from less than 50°F (10°C) to greater than 77°F (25°C) in 2001 (Brown 2002). In portions of June, July, and August, water temperatures in the San Joaquin River were greater than 77°F (25°C) (Brown 2002). The coldest temperatures (less than 50°F [10°C]) were recorded only in January, early February, and December (Brown 2002). As shown in the figure below, water temperatures in Reach 1 (at Vernalis) were very similar to temperatures in Reaches 2 (Mossdale) and 3 (Rough and Ready Island).
Ambient air temperature, temperature of water entering Reach 1, and residence time are the primary factors affecting water temperature. Jump to "SOD Concentrations > Secondary Driver—Water Temperature" under:
Reach 2 |
Reach 3 There are major uncertainties related to understanding how SOD concentrations in Reach 1 may affect DO concentrations.
Jump to "SOD Concentrations > Uncertainties in SOD" under:
Reach 2 |
Reach 3 |